


The world of data analytics has evolved vastly and now relies on an assortment of graphs that provide analytical conclusions. One of the most pivotal instruments in this broad spectrum of tools is the logarithmic chart. In this article, we are going to delve deep into the world of logarithmic charts, their applications, and their benefits for financial analysis. Keep reading to learn more.
Understanding Logarithmic Charts
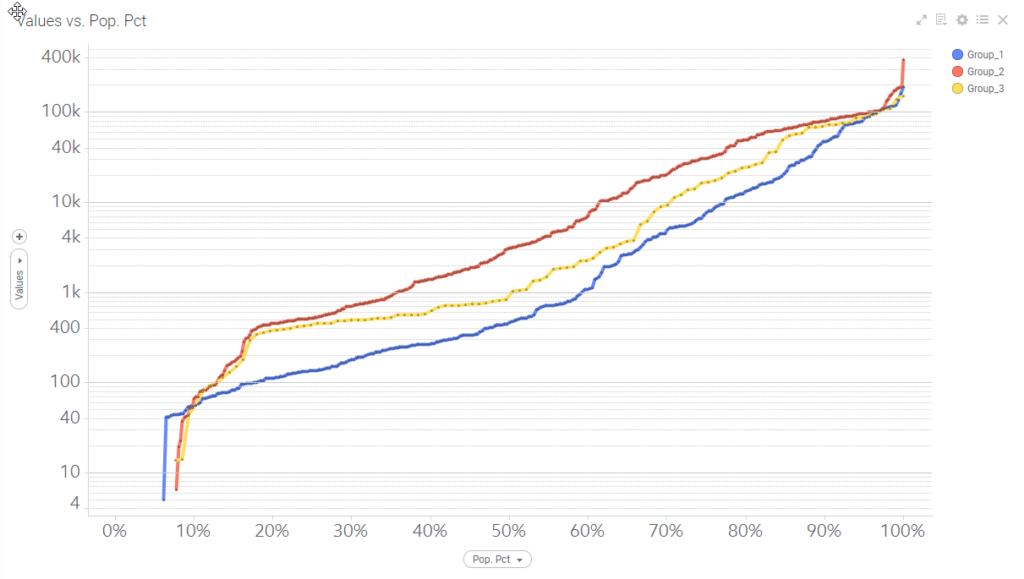
Alt Text: An image depicting logarithmic charts
The first step in mastering the use of logarithmic charts for financial analysis is understanding what they are. A logarithmic chart is a type of numerical data representation. Instead of displaying data linearly, as most charts do, they depict the data on a logarithmic scale.
This format allows for better visualization of data that spans several orders of magnitude. Moreover, it helps to keep every part of the data relatable to each other, ensuring the chart is readable and provides valuable insights.
From stocks to gross domestic product (GDP), a logarithmic chart can be applied to almost any set of financial data with significant fluctuations. It reveals patterns and trends that might otherwise be overlooked in traditional charts.
Understanding when and why to use them is the first step to unlocking their full potential.
The Theory Behind Logarithmic Charts
Logarithmic charts operate on the principle of the logarithm in mathematics. Full apprehension of the logarithmic chart goes hand in hand with understanding its basic equations and processes. The logarithm is the reverse operation to exponentiation; hence, understanding logarithms is simply about understanding powers. The chart’s backbone is the powerful mathematical tool— logarithm, which assists in multivariate analysis.
In finance and economics, logarithms are comprehensive tools used to understand and interpret compound interest, growth rates, and exponential change, among other phenomena.
In a logarithmic chart, the vertical axis uses the logarithmic scale, making large values appear compressed. Meanwhile, small values become extended. This theory makes these types of charts ideal for certain financial data sets. For example, a rapid price or value change, such as during an IPO or a market crash, can skew a linear chart, making it difficult to read.
The logarithmic scale, on the other hand, compresses those extremes and maintains the relative scale of the data, making the chart much more readable and informative.
The Role of Logarithmic Charts in Financial Analysis
Logarithmic charts play a critical role in financial analysis due to their specialized depiction of data. They make viewing and interpreting data over vast periods more manageable. This is crucial in making long-term financial decisions.
Also, in sectors like the stock market, where price changes frequently and significantly, they provide an evenly distributed depiction of price changes. This makes the chart easier to read and analyze, particularly for long-term comparison.
By understanding the degree of changes rather than absolute changes, logarithmic charts allow for more accurate predictions and decisions. As such, they’re an important tool for financial risk assessment and investment decision-making.
Finally, logarithmic charts can illustrate compound growth clearly and effectively. This is a vital factor in understanding the performance of investments and economies over the long run.
Advantages of Using Logarithmic Charts for Your Financial Data
Many advantages come with using logarithmic charts for financial analysis. One of the most notable is their effectiveness when dealing with data covering a broad range. With logarithmic charts, you can maintain a relevant scale when there are large variances in data amounts.
Another significant benefit of these charts comes into play when dealing with compound growth and interest. Logarithmic charts represent these rates in a linear fashion, making it easier to comprehend the data.
Logarithmic charts also help in the better interpretation of percentage changes. Prices, return on investment, and other financial data often make more sense to analysts and investors when seen as percentage changes. Logarithmic charts reveal these changes more accurately than standard line charts.
Finally, logarithmic charts are particularly effective at revealing long-term trends. As a result, they are irreplaceable tools for making long-term financial projections and plans.
Altogether, uninhibited understanding and efficient implementation of logarithmic charts can truly transform your financial analysis. They not only provide a more in-depth understanding of financial data but also help to make accurate predictions and ultimately reach wiser business decisions.